Only 64.5% of domains on Cloudflare nameservers are proxied
Cloudflare answers DNS (Domain Name System) for 49,920,644 of the domains in the September 2026 census: every nameserver they list is one of Cloudflare’s. That is 14.4% of the 347,691,016 domains the census scanned.
Using Cloudflare’s nameservers doesn’t put a website behind Cloudflare’s proxy. Each address record in the zone has its own switch. Cloudflare’s documentation says the setting decides whether web traffic for a record “routes through Cloudflare’s network or goes directly to your origin server.” The dashboard shows a proxied record as an orange cloud and a DNS-only record as a grey one.
The census tried each of these domains once with a web request and looked for the cf-ray header, which Cloudflare’s network adds to the responses it handles. The answers fell into three groups:
- 64.5% of the domains, 32,206,916, answered with a cf-ray. Their traffic went through Cloudflare.
- 12.1%, 6,026,259, answered without one. Another server replied directly, so these are DNS-only.
- 23.4%, 11,687,469, gave no answer at all, so the census can’t say how they are set.
The third group is the one to read with care. Count it as DNS-only and the share that isn’t proxied comes out at 35.5%, nearly three times the 12.1% the census can confirm. Among the domains that did answer, those with a cf-ray outnumber those without by more than five to one.
Three answers to one request
Most of the silent group had nothing to answer with. 7,765,093 domains, about two thirds of it, publish no IPv4 or IPv6 address at the apex, so there was no web server to ask. Another 2,829,356, about a quarter, point at an address inside Cloudflare’s published ranges and still didn’t answer. That looks like a proxied record, but no response confirmed it. The remaining 1,093,020 point at some other address, or have an IPv6 address only.
Each share in the table is of that column’s domains on Cloudflare nameservers. Generic and country-code TLDs (Top-Level Domains) follow IANA’s root zone database.
| All TLDs | Generic (gTLD) | Country code (ccTLD) | |
|---|---|---|---|
| Domains on Cloudflare nameservers | 49,920,644 | 36,906,749 | 13,013,895 |
| Answered with a cf-ray (proxied) | 64.5% | 65.6% | 61.3% |
| Answered without a cf-ray (DNS-only) | 12.1% | 10.2% | 17.3% |
| No answer | 23.4% | 24.1% | 21.4% |
| No answer, address in Cloudflare’s ranges | 5.7% | 6.3% | 3.8% |
| No answer, another address | 2.2% | 2.1% | 2.5% |
| No answer, no address at the apex | 15.6% | 15.7% | 15.2% |
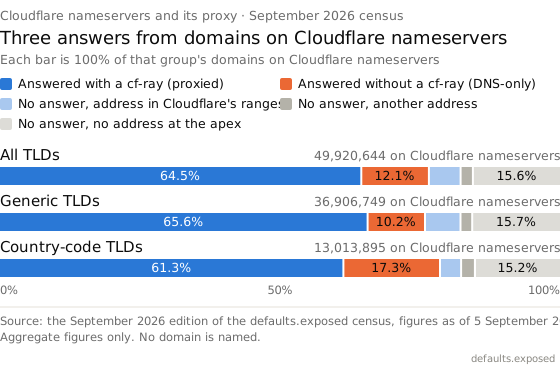
Figure 1. Each bar is 100% of the domains on Cloudflare nameservers in that group. The pale blue part and the two grey parts on the right are the domains that gave no answer.
Generic domains are proxied a little more often than country-code domains, 65.6% against 61.3%. Country-code domains answer without a cf-ray more often, 17.3% against 10.2%, and generic domains more often give no answer, 24.1% against 21.4%.
What a cf-ray shows
Cloudflare’s documentation says the cf-ray header “identifies the data center processing the request when displayed as a response header.” A response that carries one passed through Cloudflare’s network. Two checks in the census data line up with it:
- 97.8% of the domains with a cf-ray resolve to an IPv4 address inside the 15 ranges Cloudflare publishes, and that is the address the census connected to. Of the domains that answered without a cf-ray, 0.1% do, 5,992 in all.
- The scan’s own CDN (Content Delivery Network) check, which reads the same headers by its own rules, names Cloudflare for all but 12 of the domains with a cf-ray.
A cf-ray shows the route the request took. It can’t show how the owner set the record: a DNS-only record that points at a hosting platform running on Cloudflare also comes back with a cf-ray, and from outside the two look the same.
It doesn’t show that the site works, either. 2,398,709 of the proxied domains, 7.4%, answered with a 5xx server error status. Cloudflare took the request, and the reply was an error.
The largest Cloudflare TLDs
.com holds 20,126,968 of the domains on Cloudflare nameservers, 40.3% of them. The table lists the 15 TLDs with the most, and each share is of that row’s domains on Cloudflare nameservers.
| TLD | On Cloudflare nameservers | Proxied | DNS-only | No answer | No answer, no address |
|---|---|---|---|---|---|
| .com | 20,126,968 | 68.8% | 11.4% | 19.9% | 13.2% |
| .org | 1,637,537 | 69.6% | 8.0% | 22.4% | 15.2% |
| .cn | 1,575,936 | 46.7% | 43.2% | 10.0% | 3.2% |
| .net | 1,481,213 | 67.5% | 8.6% | 23.9% | 17.3% |
| .cc | 1,154,409 | 33.8% | 15.3% | 50.9% | 42.5% |
| .top | 1,141,360 | 49.6% | 10.0% | 40.4% | 28.9% |
| .shop | 1,122,311 | 53.5% | 16.8% | 29.7% | 19.2% |
| .uk | 1,096,780 | 67.6% | 9.6% | 22.7% | 17.1% |
| .xyz | 1,079,826 | 51.8% | 8.7% | 39.5% | 30.2% |
| .info | 979,891 | 69.4% | 2.8% | 27.9% | 13.5% |
| .br | 690,341 | 69.3% | 16.0% | 14.7% | 10.1% |
| .site | 590,992 | 74.4% | 3.8% | 21.8% | 10.5% |
| .de | 535,616 | 68.1% | 9.7% | 22.3% | 15.6% |
| .co | 521,306 | 61.9% | 9.7% | 28.3% | 18.7% |
| .app | 503,276 | 60.6% | 14.0% | 25.4% | 17.8% |
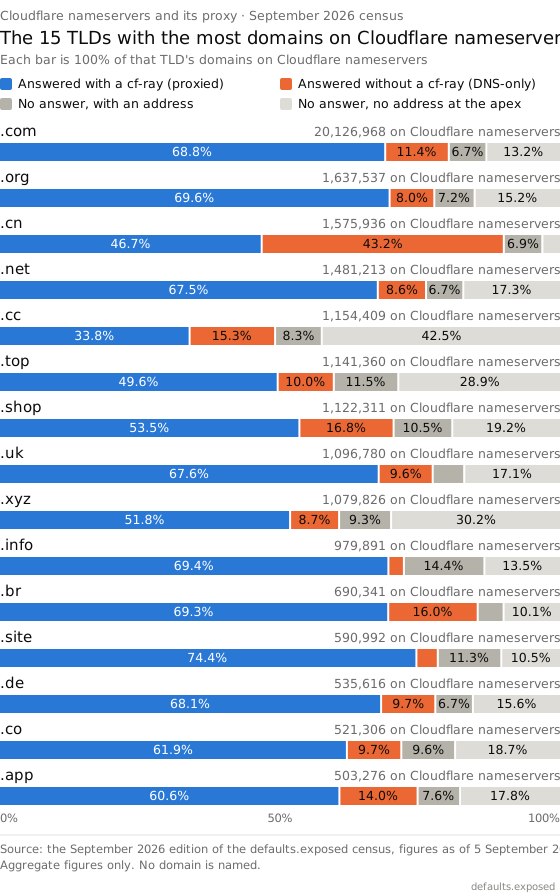
Figure 2. The 15 largest, in the order of the table, with each TLD’s count of domains on Cloudflare nameservers on the right.
Two rows stand out. .cn is the largest country code on Cloudflare’s nameservers, with 1,575,936 domains, 28.4% of every .cn domain the census scanned. 43.2% of them answered without a cf-ray, the highest DNS-only share of the 15 and close to the 46.7% that answered with one.
.cc has the largest share of its own domains on Cloudflare’s nameservers, 54.5%. 50.9% of those gave no answer, and 42.5% have no address at the apex at all. The census can’t show why either TLD looks the way it does.
The top 30 TLDs by proxied share
The ranking covers the 183 TLDs with at least 10,000 domains on Cloudflare nameservers, 93 generic and 90 country code, which between them hold 98.0% of all such domains. Shares are of each row’s domains on Cloudflare nameservers. Rows that tie at one decimal are ordered by the unrounded share.
| Rank | TLD | Type | On Cloudflare nameservers | Proxied | DNS-only | No answer |
|---|---|---|---|---|---|---|
| 1 | .onl | generic | 43,820 | 95.9% | 0.9% | 3.2% |
| 2 | .bio | generic | 23,812 | 93.0% | 2.6% | 4.4% |
| 3 | .ws | country code | 36,888 | 92.2% | 3.3% | 4.5% |
| 4 | .bet | generic | 110,325 | 92.1% | 3.2% | 4.7% |
| 5 | .plus | generic | 13,666 | 87.0% | 4.3% | 8.6% |
| 6 | .casino | generic | 57,123 | 86.3% | 7.0% | 6.7% |
| 7 | .blog | generic | 85,046 | 85.3% | 2.3% | 12.4% |
| 8 | .bid | generic | 22,360 | 85.3% | 7.0% | 7.7% |
| 9 | .center | generic | 13,486 | 84.4% | 3.7% | 11.9% |
| 10 | .buzz | generic | 146,354 | 83.3% | 4.3% | 12.4% |
| 11 | .pl | country code | 247,746 | 83.0% | 8.1% | 8.9% |
| 12 | .fr | country code | 260,240 | 82.8% | 7.8% | 9.4% |
| 13 | .media | generic | 26,567 | 82.6% | 5.0% | 12.4% |
| 14 | .sk | country code | 27,776 | 82.2% | 9.3% | 8.5% |
| 15 | .pics | generic | 63,001 | 82.0% | 1.4% | 16.6% |
| 16 | .bar | generic | 17,988 | 82.0% | 2.9% | 15.1% |
| 17 | .ua | country code | 71,327 | 81.6% | 11.5% | 7.0% |
| 18 | .wiki | generic | 50,777 | 81.3% | 2.8% | 15.9% |
| 19 | .best | generic | 37,758 | 80.9% | 2.9% | 16.1% |
| 20 | .lt | country code | 25,273 | 79.6% | 9.9% | 10.5% |
| 21 | .ph | country code | 19,824 | 79.2% | 8.7% | 12.1% |
| 22 | .at | country code | 71,398 | 77.8% | 10.5% | 11.7% |
| 23 | .im | country code | 22,727 | 77.4% | 7.3% | 15.3% |
| 24 | .it | country code | 219,045 | 76.9% | 12.5% | 10.5% |
| 25 | .cz | country code | 79,651 | 76.5% | 12.2% | 11.3% |
| 26 | .es | country code | 177,239 | 76.2% | 12.2% | 11.6% |
| 27 | .se | country code | 89,031 | 76.2% | 10.9% | 13.0% |
| 28 | .fit | generic | 24,828 | 76.1% | 6.4% | 17.4% |
| 29 | .games | generic | 25,321 | 76.0% | 7.1% | 16.9% |
| 30 | .guru | generic | 12,447 | 75.8% | 6.2% | 17.9% |
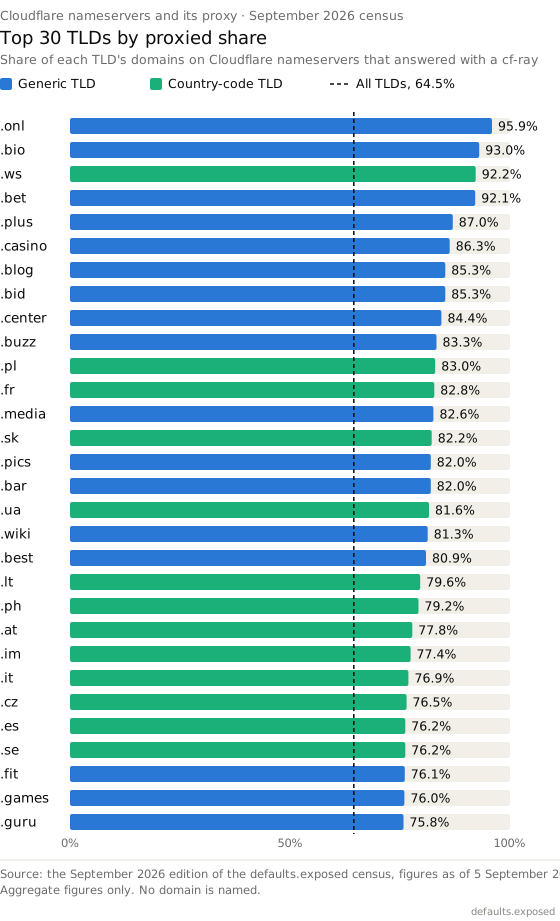
Figure 3. The top 30 by proxied share, generic TLDs in blue and country codes in green, with the all-TLD figure as a dashed line.
Four TLDs pass 90%: .onl, .bio, .ws and .bet. 13 of the 30 are country codes, among them .pl, .fr, .it and .es.
At the other end of the ranking the low shares come mostly from the silent group. Of the 10 TLDs with the lowest proxied share, 8 have more domains that gave no answer than either of the other two groups. The exceptions are .lol and .cv, where more domains answered without a cf-ray than with one. The lowest is .yachts, at 17.4% proxied, where 77.7% of the domains on Cloudflare nameservers have no address at the apex.
Edge fingerprints across every domain that answered
The cf-ray is one of several headers that name the network a response came through. The census looked for 14 of them across the 267,525,457 domains that returned HTTP (Hypertext Transfer Protocol) headers, whatever their nameservers. Each share in the table is of those domains, or of the generic or country-code part of them, and a domain can match more than one fingerprint.
| Network | Kind | Fingerprint | Domains | Share | gTLD share | ccTLD share |
|---|---|---|---|---|---|---|
| Cloudflare | CDN or security service | cf-ray header | 44,559,416 | 16.66% | 17.75% | 14.00% |
| Vercel | Hosting platform | x-vercel-id or server: Vercel | 4,483,233 | 1.68% | 1.57% | 1.92% |
| Fastly | CDN or security service | x-served-by naming a Fastly cache node (cache-…), x-fastly-request-id or fastly-restarts | 1,829,476 | 0.68% | 0.68% | 0.68% |
| Google Cloud load balancing | CDN or security service | via: 1.1 google | 1,630,681 | 0.61% | 0.68% | 0.44% |
| Netlify | Hosting platform | server: Netlify or x-nf-request-id | 1,497,108 | 0.56% | 0.56% | 0.56% |
| Amazon CloudFront | CDN or security service | x-amz-cf-id or x-amz-cf-pop | 1,188,737 | 0.44% | 0.44% | 0.46% |
| Sucuri | CDN or security service | x-sucuri-id, x-sucuri-cache or server: Sucuri | 144,918 | 0.05% | 0.07% | 0.03% |
| BunnyCDN | CDN or security service | server: BunnyCDN or cdn-pullzone | 112,353 | 0.04% | 0.05% | 0.03% |
| Akamai | CDN or security service | server: AkamaiGHost, x-akamai-transformed or akamai-grn | 64,655 | 0.02% | 0.02% | 0.02% |
| Azure Front Door | CDN or security service | x-azure-ref | 57,939 | 0.02% | 0.02% | 0.02% |
| Imperva | CDN or security service | x-iinfo, or x-cdn: Imperva | 56,807 | 0.02% | 0.02% | 0.02% |
| QUIC.cloud | CDN or security service | x-qc-pop | 30,739 | 0.01% | 0.01% | 0.02% |
| KeyCDN | CDN or security service | server: keycdn | 213 | under 0.01% | under 0.01% | under 0.01% |
| CDN77 | CDN or security service | server: CDN77 | 111 | under 0.01% | under 0.01% | under 0.01% |
| Any of the 14 | 54,201,173 | 20.3% | 21.3% | 17.7% |
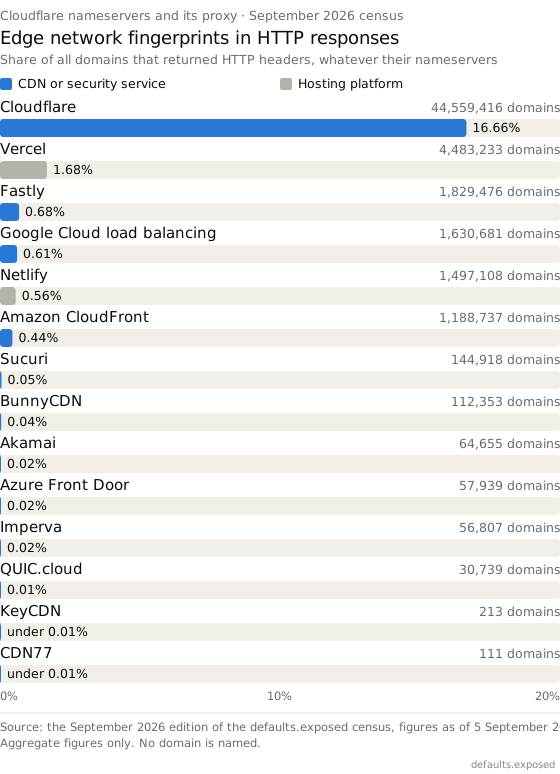
Figure 4. Each bar is one fingerprint’s share of the 267,525,457 domains that returned headers, in the order of the table. Hosting platforms are drawn in grey. Bars shorter than 1px are drawn 1px wide so they stay visible. That applies to the last 6 rows, and for those the figure beside the bar is the one to read.
Cloudflare’s header turned up on 44,559,416 domains, 16.66% of those that answered and more than the other 13 fingerprints put together. 12,347,008 of them, 27.7%, aren’t on Cloudflare’s nameservers at all. Their records point at Cloudflare’s network from another DNS provider, directly or through a platform that runs on it.
Some counts here are floors. Akamai doesn’t name itself in most of the responses it serves, so its 64,655 domains undercount it. The scan’s own CDN check counts any x-served-by header as Fastly, which gives 7,354,884 domains, about four times the table’s figure. Other services send that header too, Namecheap’s URL forwarding among them, so the table counts only values that name a Fastly cache node.
Beside W3Techs
W3Techs publishes reverse proxy shares from its own survey of websites. On 4 October 2026 it put Cloudflare in front of 26.4% of the websites in its sample, which is 85.3% of the sites using any reverse proxy it tracks. It had Amazon CloudFront at 1.7%, Fastly at 0.9% and Akamai at 0.6%. Its sample is well over 20 million sites that W3Techs judges to have meaningful content. It leaves out default server pages, near-duplicates and domains that redirect elsewhere, and it counts subdomains as part of their site.
This page counts every domain that returned headers, 267,525,457 of them, parked and placeholder pages included, and finds Cloudflare’s header on 16.66%. The populations differ, and the W3Techs reading is a month later. The two figures sit side by side here and aren’t netted against each other.
How the count was taken
- The population is every domain the September 2026 census scanned, 347,691,016, one row per domain. A domain counts as answering, or as carrying a cf-ray, if any of its scan rows did. The per-TLD counts match the site’s TLD data file exactly. 49,258,943 of the 49,920,644 domains on Cloudflare nameservers, 98.7%, also carry a grade. The rest were scanned but couldn’t be graded.
- A domain is on Cloudflare nameservers when every NS record the census captured is a name under ns.cloudflare.com. 18,691 domains list Cloudflare’s nameservers beside another operator’s and are left out. So are zones that use nameservers under the customer’s own name, which Cloudflare offers on some plans, because the census can’t tell them apart from any other server. The data page’s nameserver table gives Cloudflare 49,278,555 on a different rule: scan rows that carry a grade, by the first nameserver listed, with re-scans not merged.
- The census sends an HTTPS (Hypertext Transfer Protocol Secure) request to the apex, at the first address it resolved for the name, and tries again with GET when the first request is refused. The census follows at most one redirect, and only within the same site. If HTTPS fails it tries plain HTTP on port 80. A domain with no A or AAAA record can’t be reached, so it always lands in the no-answer group. Any response headers count as an answer, whatever the status code.
- Cloudflare’s ranges are the 15 IPv4 prefixes Cloudflare publishes, checked against the domain’s first A record. IPv6 addresses aren’t checked.
- TLD types follow IANA’s root zone database. Internationalised TLDs are taken from the domain name, so each counts on its own.
- The fingerprints are the headers listed in the table, matched on their names and, where given, their values.
What the census can and can’t see
- One attempt per domain, from the census’s own network, in early September 2026. A site that was down at that moment, or that turns away unknown clients, lands in the no-answer group.
- The apex only. A DNS-only apex that redirects visitors to a proxied www on the same site counts as proxied, because the census follows that one redirect. A proxied www behind an apex that doesn’t redirect isn’t seen.
- A cf-ray can’t show how the owner set the proxy switch, as the section on what a cf-ray shows explains.
- The census can’t tell a DNS-only record whose server was down from a proxied one that failed to respond.
- Domains whose owners asked the census not to contact their servers get no request, and count as no answer.
- Every count is of domains. A domain counts once whether it serves millions of visitors or none.
- All figures are aggregates. No domain is named on this page, and the census doesn’t publish an individual domain’s result.
The DNS page covers nameservers and delegation, and the census page describes how the scan works.
See your own
The free scan reads any domain live. It sends the same request the census sends and runs the same checks, including the informational CDN and WAF (Web Application Firewall) check, which never changes the grade.
Figures as of 5 September 2026, from the September 2026 edition of the defaults.exposed census. W3Techs figures are from its reverse proxy survey of 4 October 2026 and are not census data. Cloudflare quotations are from its developer documentation as read on 4 October 2026. Census numbers move every month; the current values are on the data page.