Let's Dig Into WHOIS: The Best-Performing TLDs for Domain Security (2026)
Published · updated
Figures as of 2026-08-16 · methodology v8. Aggregate census data — no individual business’s grade is ever published. See how we grade.
Run a dig against the whole internet and one number resolves above all others: across 377 million graded domains, only 0.146% — about 1 in 700 — earn an A or A+, the two top grades for security configuration. The A-tier is the rarest air online. But it is not spread evenly: a few top-level domains carry roughly 7.4× their share of it. So let’s run a WHOIS on the winners and ask which TLDs actually configure security well.
dig +short: the A/A+ leaderboard
Ranked by the share of each TLD’s graded domains earning an A or A+ — robust-coverage endings only (at least 100,000 graded domains, which leaves 133 TLDs in the running):
| # | TLD | A/A+ share |
|---|---|---|
| 1 | .dk | 1.09% |
| 2 | .click | 0.76% |
| 3 | .sk | 0.68% |
| 4 | .nl | 0.62% |
| 5 | 0.55% | |
| 6 | .co | 0.51% |
| 7 | .sg | 0.50% |
| 8 | .ch | 0.50% |
| 9 | .no | 0.49% |
| 10 | .info | 0.40% |
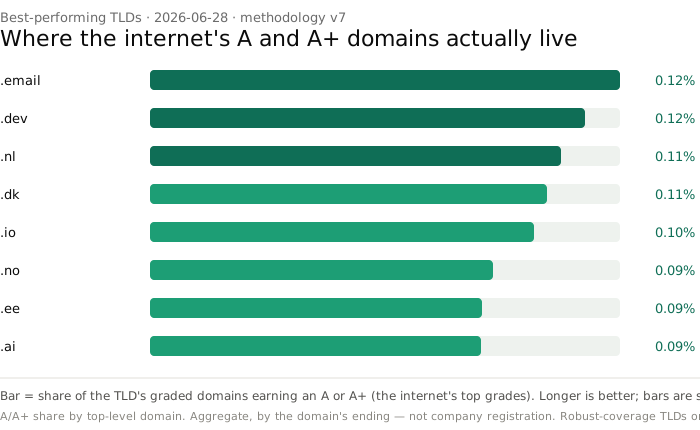
.dk leads at 1.09%. Read that figure twice: even the best-configured corner of the internet still clears only a fraction of one percent at the A tier. “Best-performing” here is a relative crown, not a victory lap — which is the uncomfortable theme running through the whole grade curve.
WHOIS actually winning
Two tribes sit at the top of the table, and neither is there by chance.
The builder endings. Domains like .dk, .click and .email are bought, overwhelmingly, by people who already know what an MX record is. Developers, infrastructure teams and technology companies gravitate to these endings — and the same people reach for DMARC, HSTS and DNSSEC by reflex. The TLD is really a proxy for the technical literacy of whoever publishes its DNS.
Northern Europe. Country endings like .sk, .nl and .co cluster near the top because their registries have spent years pushing good defaults — DNSSEC adoption across the Netherlands and the Nordics is among the highest on the planet. When a registry nudges every registrant toward signing their zone, the whole TLD’s grade curve shifts with it.
The takeaway is not “buy a .dk domain and you’re safe.” It is that good configuration concentrates wherever either the buyers or the registry already care.
Resolving the .com question
Here is the twist. The A/A+ share of .com — the largest top-level domain on the internet — is just 0.131%, below the 0.146% internet-wide average and a fraction of the 1.09% that .dk manages. Scale is not security. An ending with hundreds of millions of domains is an ending with hundreds of millions of owners, most of whom never published an SPF record — and the average resolves downward accordingly.
That is exactly why a leaderboard rewards the small, opinionated endings over the giant default one.
It’s not the TLD — it’s the records you publish
A domain does not earn an A because of the letters after the dot. It earns one because someone published the right DNS and HTTP records:
- Email that can’t be forged — SPF, DKIM, and DMARC at enforcement (
p=quarantineorp=reject), neverp=none. (Fix DMARC →) - TLS done properly — a valid modern certificate plus HSTS. (Fix HSTS →)
- A hardened zone — DNSSEC so answers can’t be quietly forged, and CAA so only your chosen authority can issue certificates. (Fix DNSSEC →)
- The security headers that finish the job — Content-Security-Policy, X-Frame-Options, and the rest.
Every one of those is free and available on any TLD. The leaders simply turned them on. For the full pattern, see what the A-grade elite do differently.
Frequently asked questions
Which TLD has the most secure domains? As of 2026-08-16, .dk has the highest share of domains earning an A or A+ (1.09%), among TLDs with at least 100,000 graded domains. The top of the table is dominated by developer-focused generic TLDs and Northern European country endings.
Does my TLD determine my security grade? No. A TLD correlates with security only because of who tends to register it. Your grade is set entirely by the DNS and HTTP records you publish — and an A is achievable on any ending, including .com.
Why is the A/A+ share so low everywhere? A and A+ require getting email authentication, TLS, DNS hardening and security headers all right at once. Only 0.146% of the 377 million graded domains clear that bar — about 1 in 700. Most domains miss on enforced email authentication alone.
How is this measured? Each figure is the share of a TLD’s graded domains at A or A+, computed from the live census across 34 checks. Figures are aggregate and grouped by the domain’s ending (not company registration); robust-coverage TLDs only. See how we grade.
Dig into your own domain
You don’t need a .dk domain to score like one. Check privately and free, and get the exact list of records to publish to climb the grade curve.
Check your domain → · The most spoofable countries → · Aggregate data only; individual grades are shown only to verified owners. Data stored and processed in the EU.